A quick excursion into building my own gross-net salary calculator
Ask yourself: Do you actually know how your net salary is calculated in detail? How much of your gross salary goes to income tax or health insurance? I’d argue that most people (at least in Germany) don’t know or simply don’t care. For example, I’ve encountered numerous people who don’t understand Germany’s progressive tax rate system and still think that if they go over a certain salary threshold, they’ll actually take home less money.
Sure, this topic is not as sexy as investing in stocks, but I think it’s still an important piece of financial literacy. Just think about how much time you spend working in your life — shouldn’t you at least know a bit more about where part of your hard-earned money goes to?
Personally, I wanted to change this and made it my new year’s resolution to finally dive a bit deeper.
BYOC (Bring your own calculator)
Of course, the reasonable thing to do would be to just read through some articles, maybe watch a video or two on YouTube, and call it a day. I could also just create a spreadsheet in Excel. But that’s boring, I wanted something more tangible. Also, why miss an opportunity to unnecessarily over-engineer a simple task?
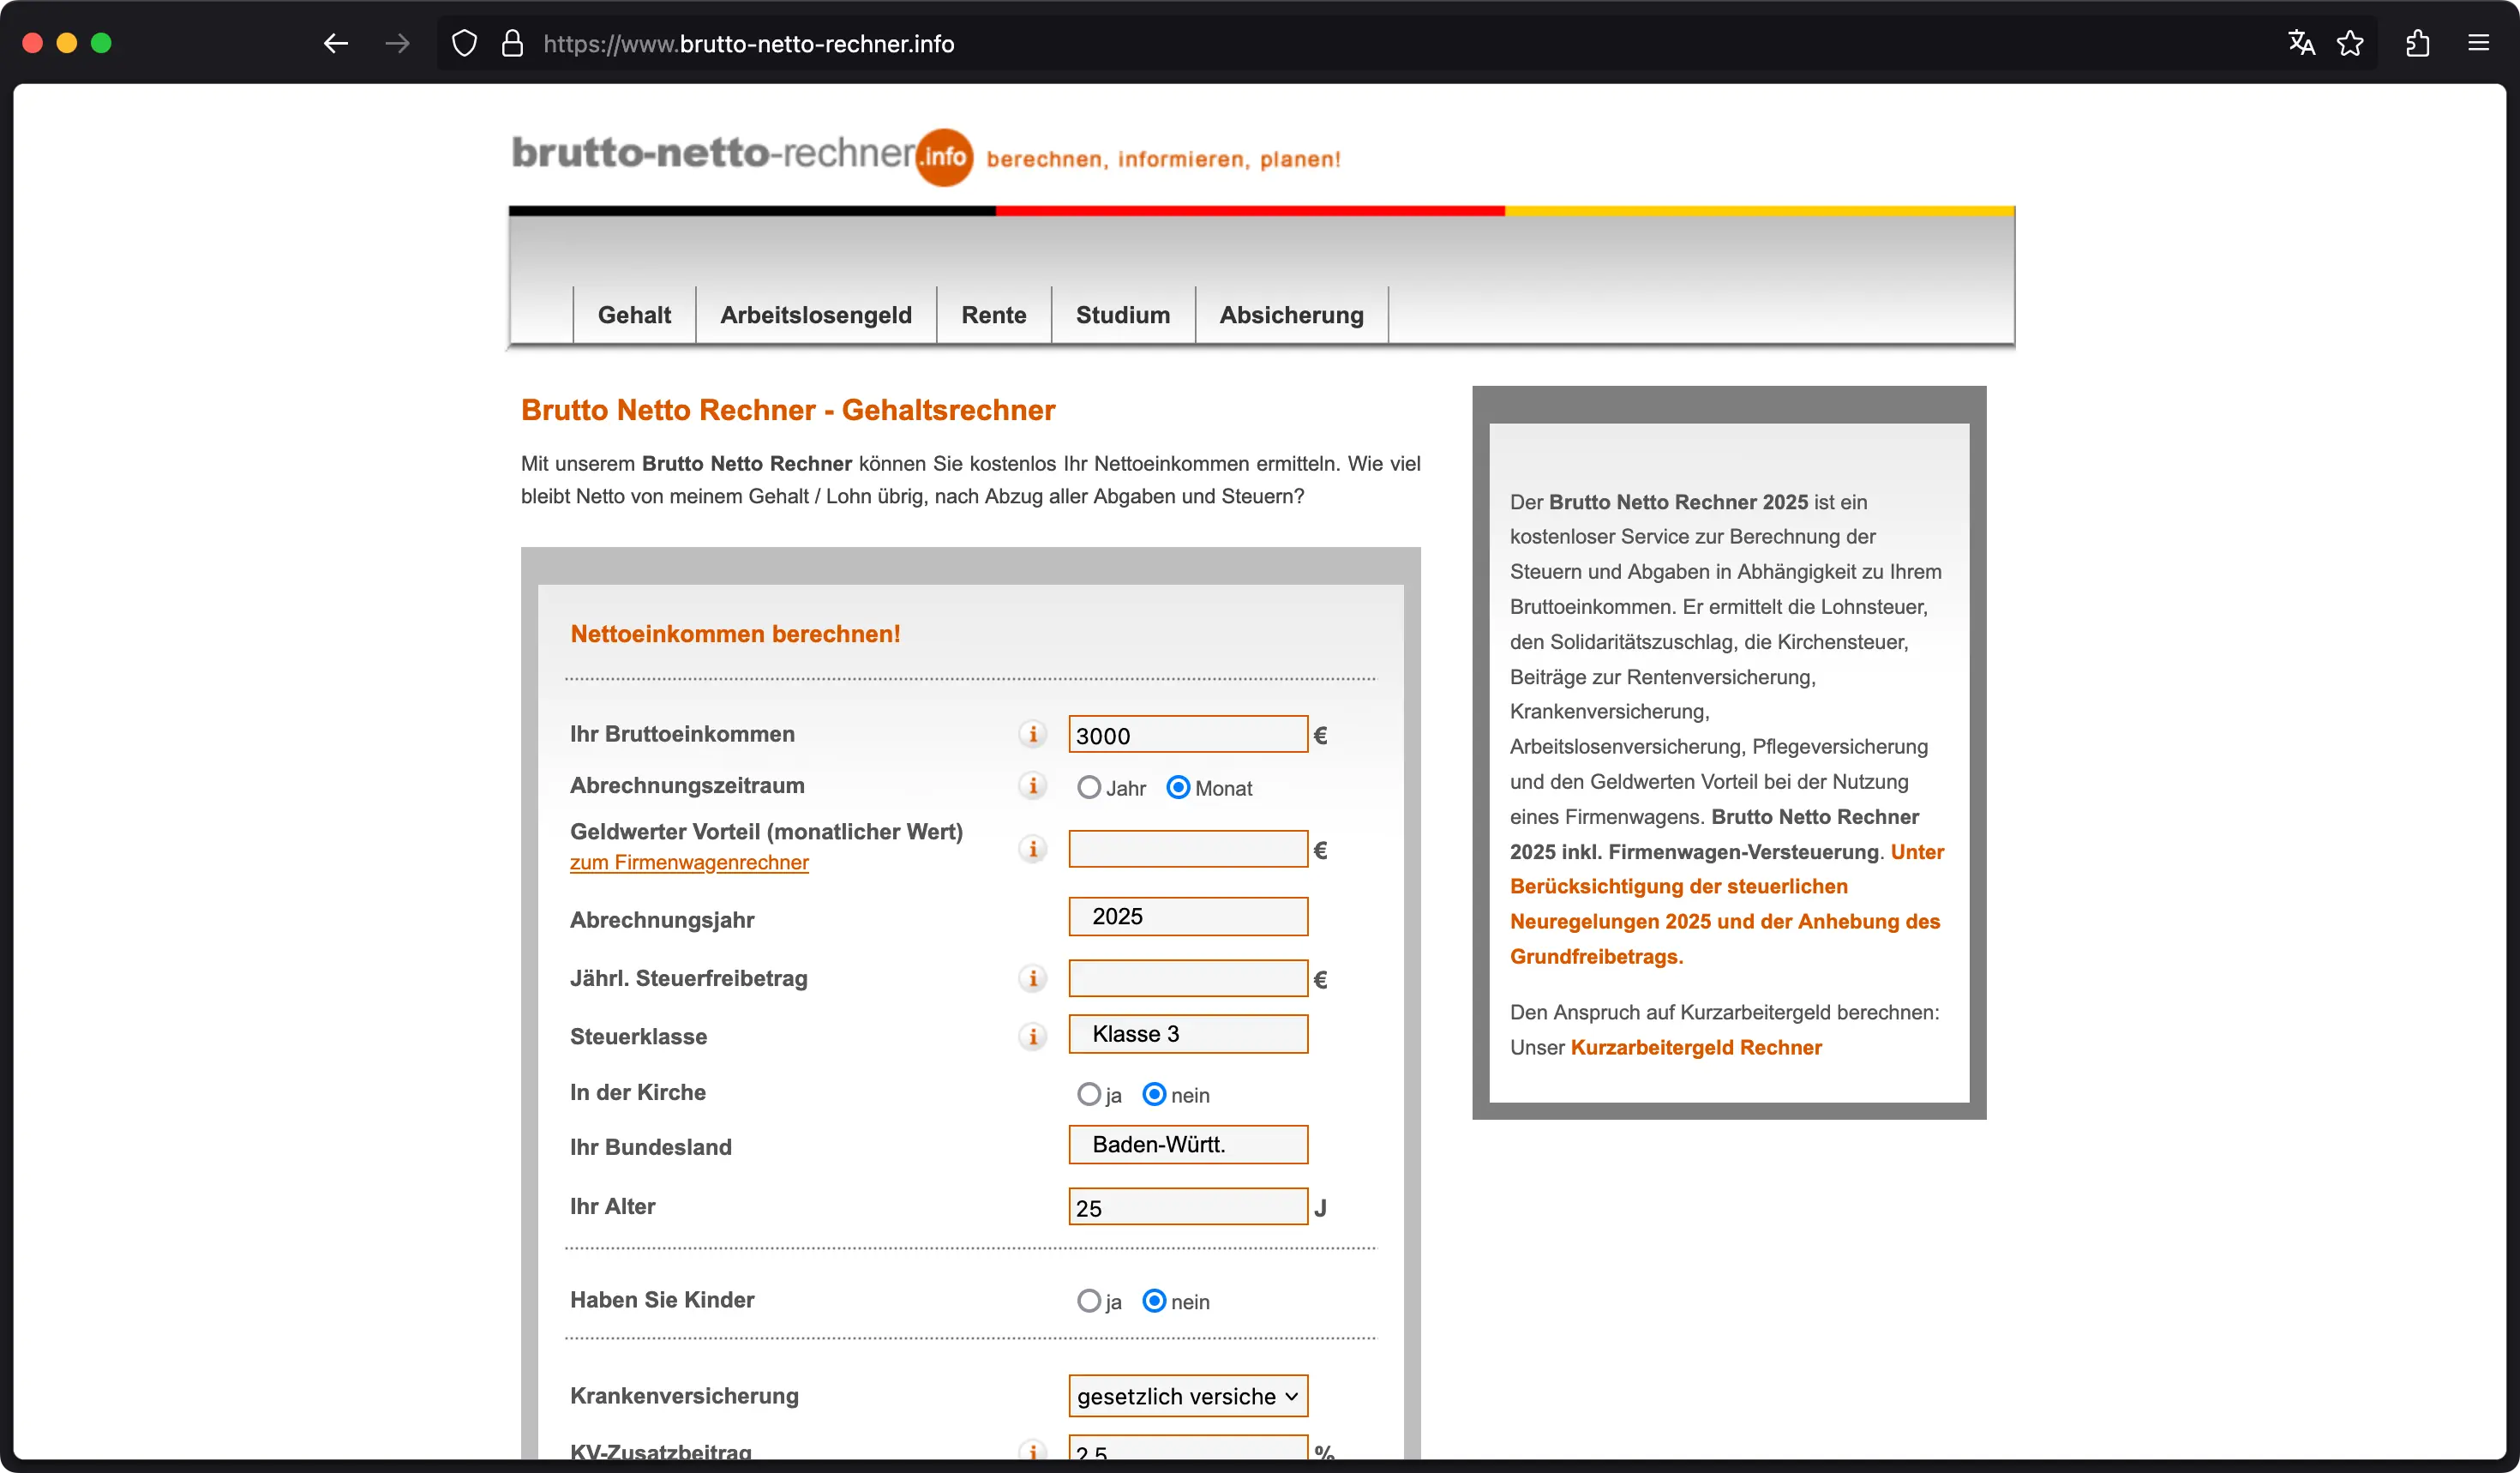
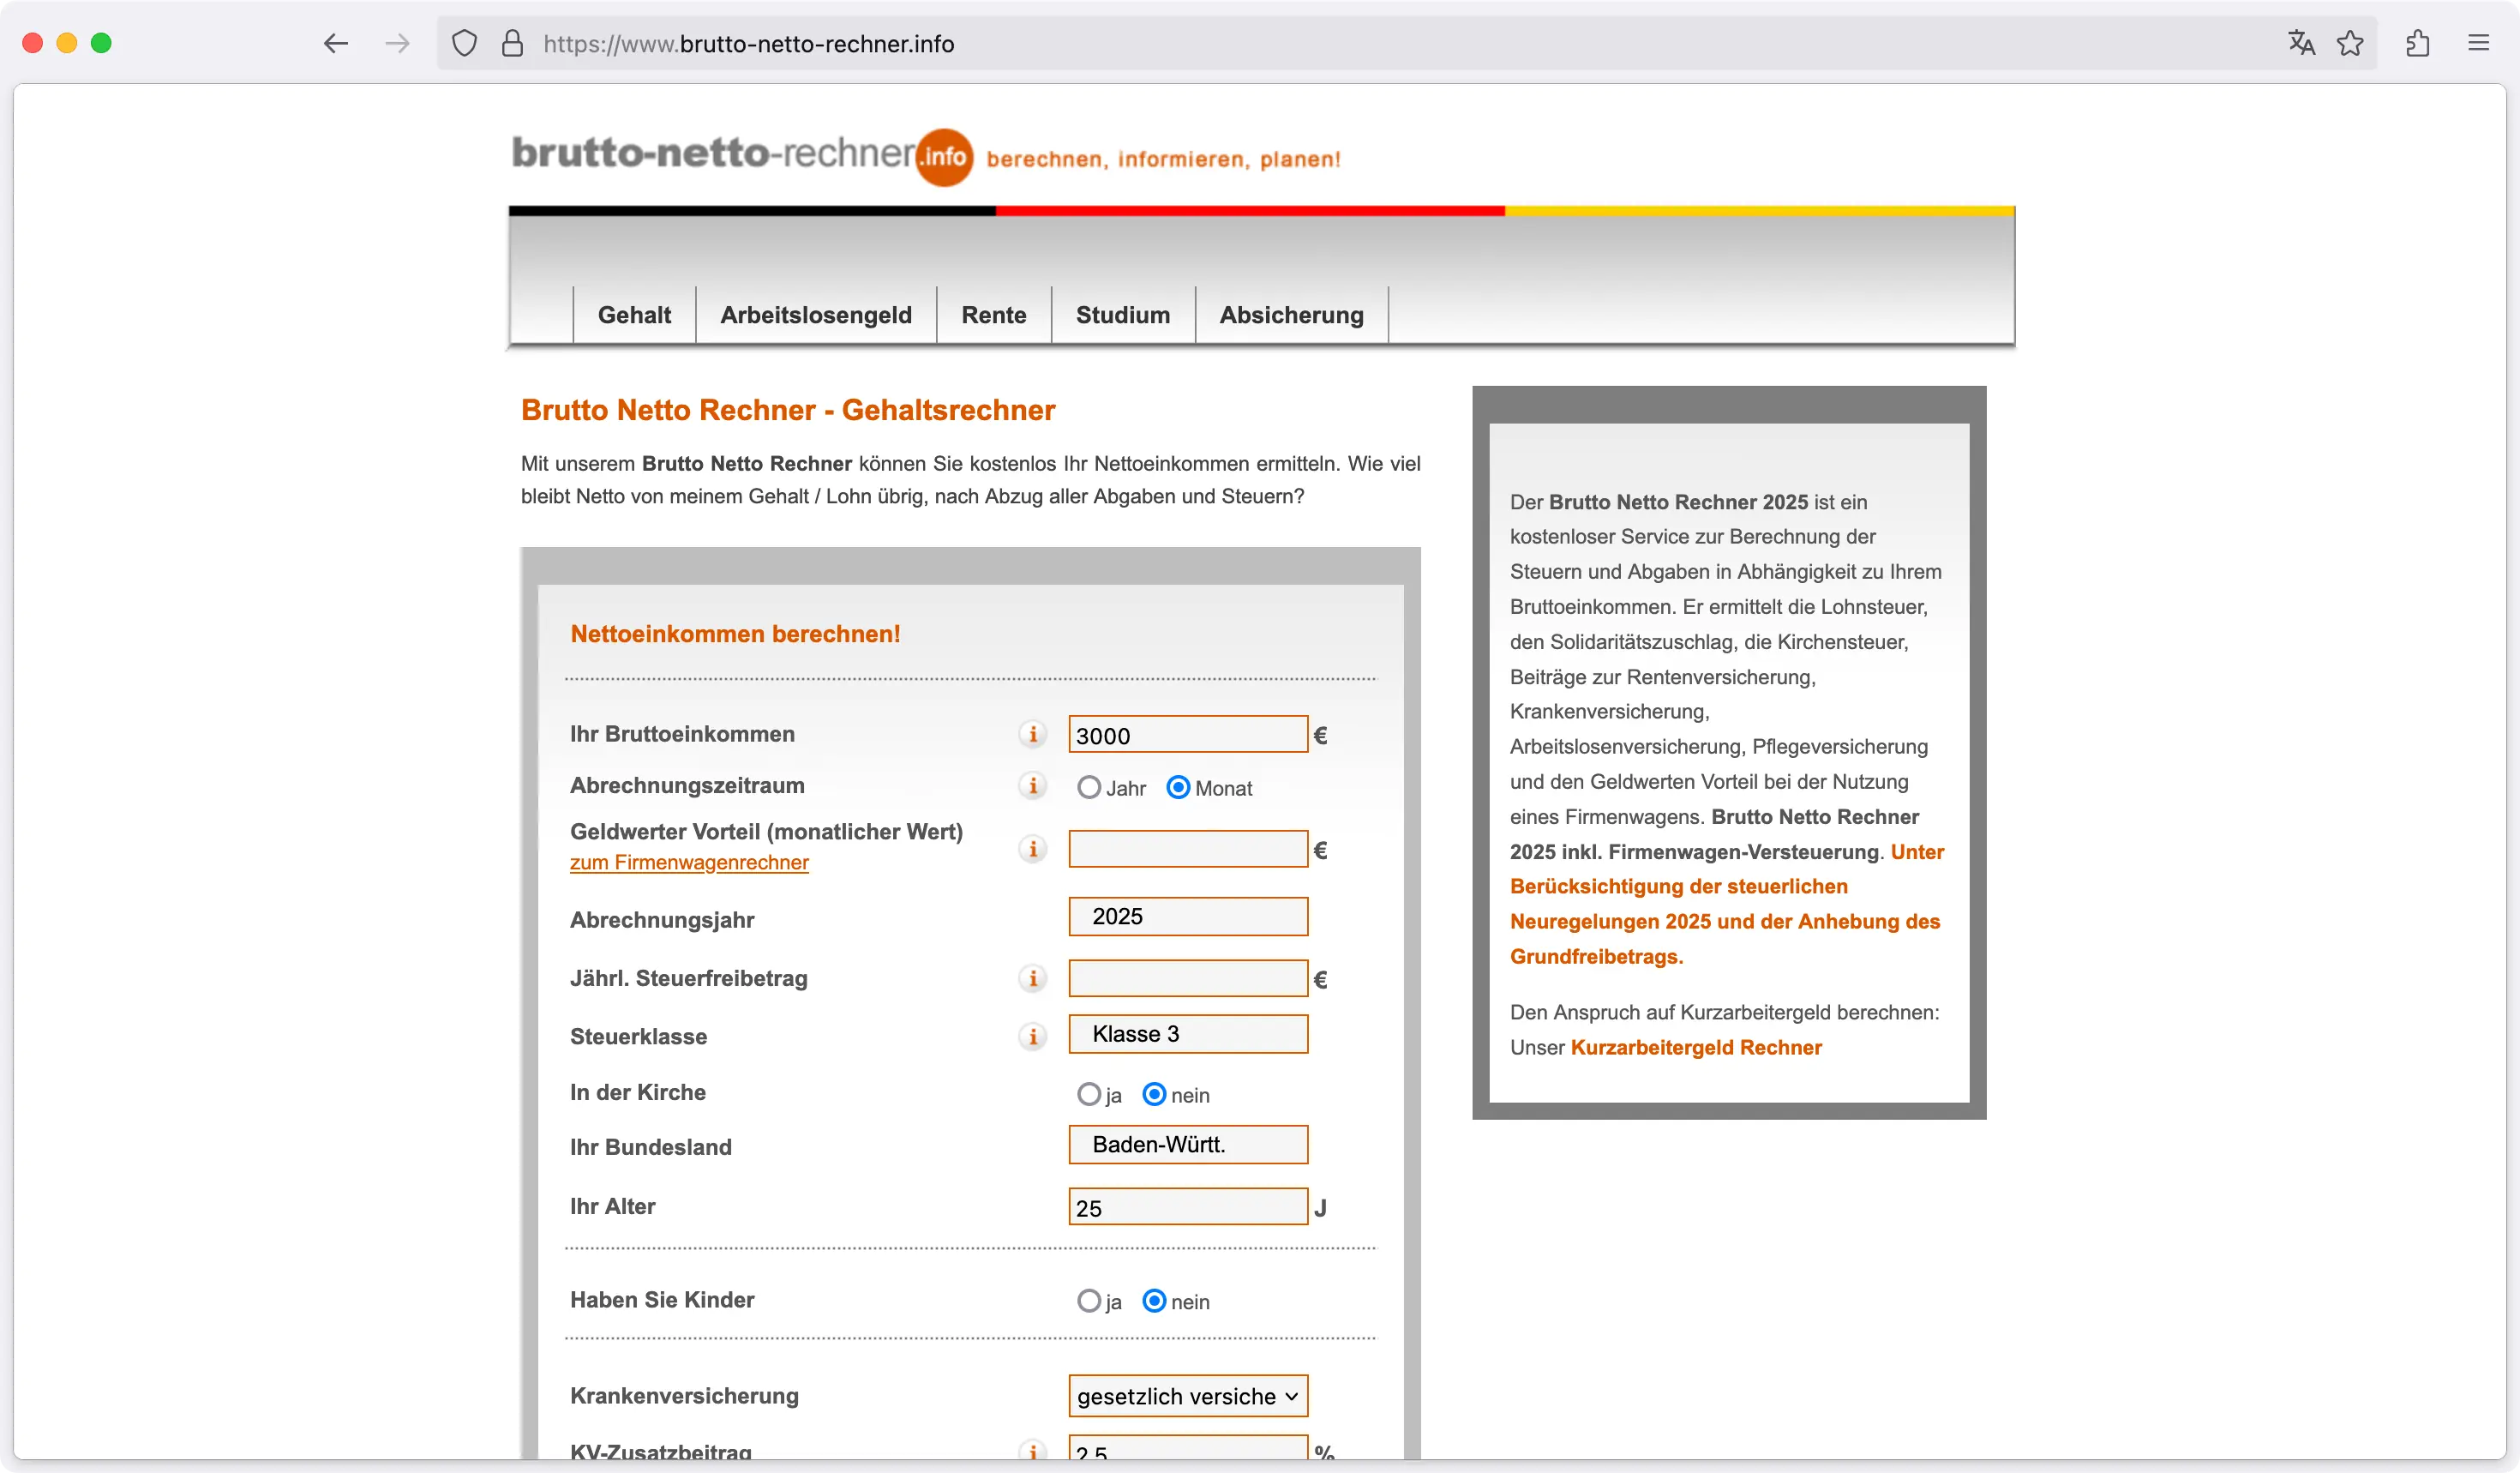
Instead, I wanted to build something that exists plenty of times already, something that I use regularly: a web-based gross-net salary calculator. I was particularly motivated because every calculator I found left me dissatisfied in some way, whether it was the UI/UX, ads, or lack of insights provided.
Designing my ideal salary calculator
I’m not an UI/UX designer, but I’ve done my fair share of frontend development to get a a good idea of how things should look and feel. I set myself a rough framework of aspects that my app should offer:
- It should feel like an interactive dashboard
- Dark/light theme, responsive and minimal design, no ads
- Results should be presented in a table and explorable via some visualizations
- High information density, most important information should fit on one desktop screen
I also did a quick sketch of what I had in mind:


Let’s get started
Before I could actually start implementing, I needed to understand how the calculation of all key components works. For learning purposes, I decided to implement all the logic myself instead of using external APIs. As already mentioned, my knowledge of German income tax laws is quite limited. So who to ask? Well, why not try the source: the website of the Bundesfinanzministerium/Federal Ministry of Finance (BMF).
To my luck, and in contrast to common belief, digitalization in Germany does not just consist of fax machines and slow internet. Well, it mostly does, but we caught up: The BMF actually provides a program flow chart for the automatic income tax calculation in 2025!
Unfortunately, it’s a whopping 57 pages long and contains…
- 9 pages of variable definitions,
- including 121 variables (input, output, internal)
- and 24 flow charts, with some of them looking like this:


It turns out though, they are not particularly complex or hard to implement. For example, a rather large part of this flow chart roughly translates to the following code:
export const calculateMRE4 = () => {
  const internalFields = InternalFieldsClient.instance;
  const userInputs = UserInputsClient.instance;

  if (internalFields.ZVBEZJ === 0) {
    internalFields.FVBZ = 0;
    internalFields.FVB = 0;
    internalFields.FVBZSO = 0;
    internalFields.FVBSO = 0;
  } else {
    if (userInputs.VJAHR < 2006) {
      internalFields.J = 1;
    } else if (userInputs.VJAHR < 2058) {
      internalFields.J = userInputs.VJAHR - 2004;
    } else {
      internalFields.J = 54;
    }

    if (userInputs.LZZ === CalculationPeriod.enum.YEAR) {
      internalFields.VBEZB = userInputs.VBEZM * userInputs.ZMVB + userInputs.VBEZS;
      internalFields.HFVB = roundUpToFullEuro(
        (internalFields.getTAB2(internalFields.J) / 12) * userInputs.ZMVB,
      );
      internalFields.FVBZ = roundUpToFullEuro(
        (internalFields.getTAB3(internalFields.J) / 12) * userInputs.ZMVB,
      );
    }

    // ...
  }

  calculateMRE4ALTE();
};
Still, naive me thought, the whole calculation to get my net salary would look something like this — but there are 23 more flows to go! And that’s just the tip of the iceberg. There is also church tax1 as well as statutory health, nursing care, pension, and unemployment insurance contributions, which partially depend on the income tax calculation results but are not part of the income tax flow at all. And don’t get me started on their private counterparts, chamber contribution for physicians, and whatever else is out there. To spare my sanity, I decided to exclude those edge cases and focus on the basics for now.
From a tech stack perspective, there is nothing particularly fancy going on. The app is built using Next.js and TypeScript, because that’s just what I’m most comfortable with. For styling, I’ve opted for shadcn/ui (which I wanted to try out for a while now). Coming from plain Tailwind or, even worse, styled-components, this really felt like a breath of fresh air. Together with zod for input validation, implementing forms also finally felt just right.
If you’d like to have a look at the code for yourself, feel free to check it out here.
Get to it, show me the result!
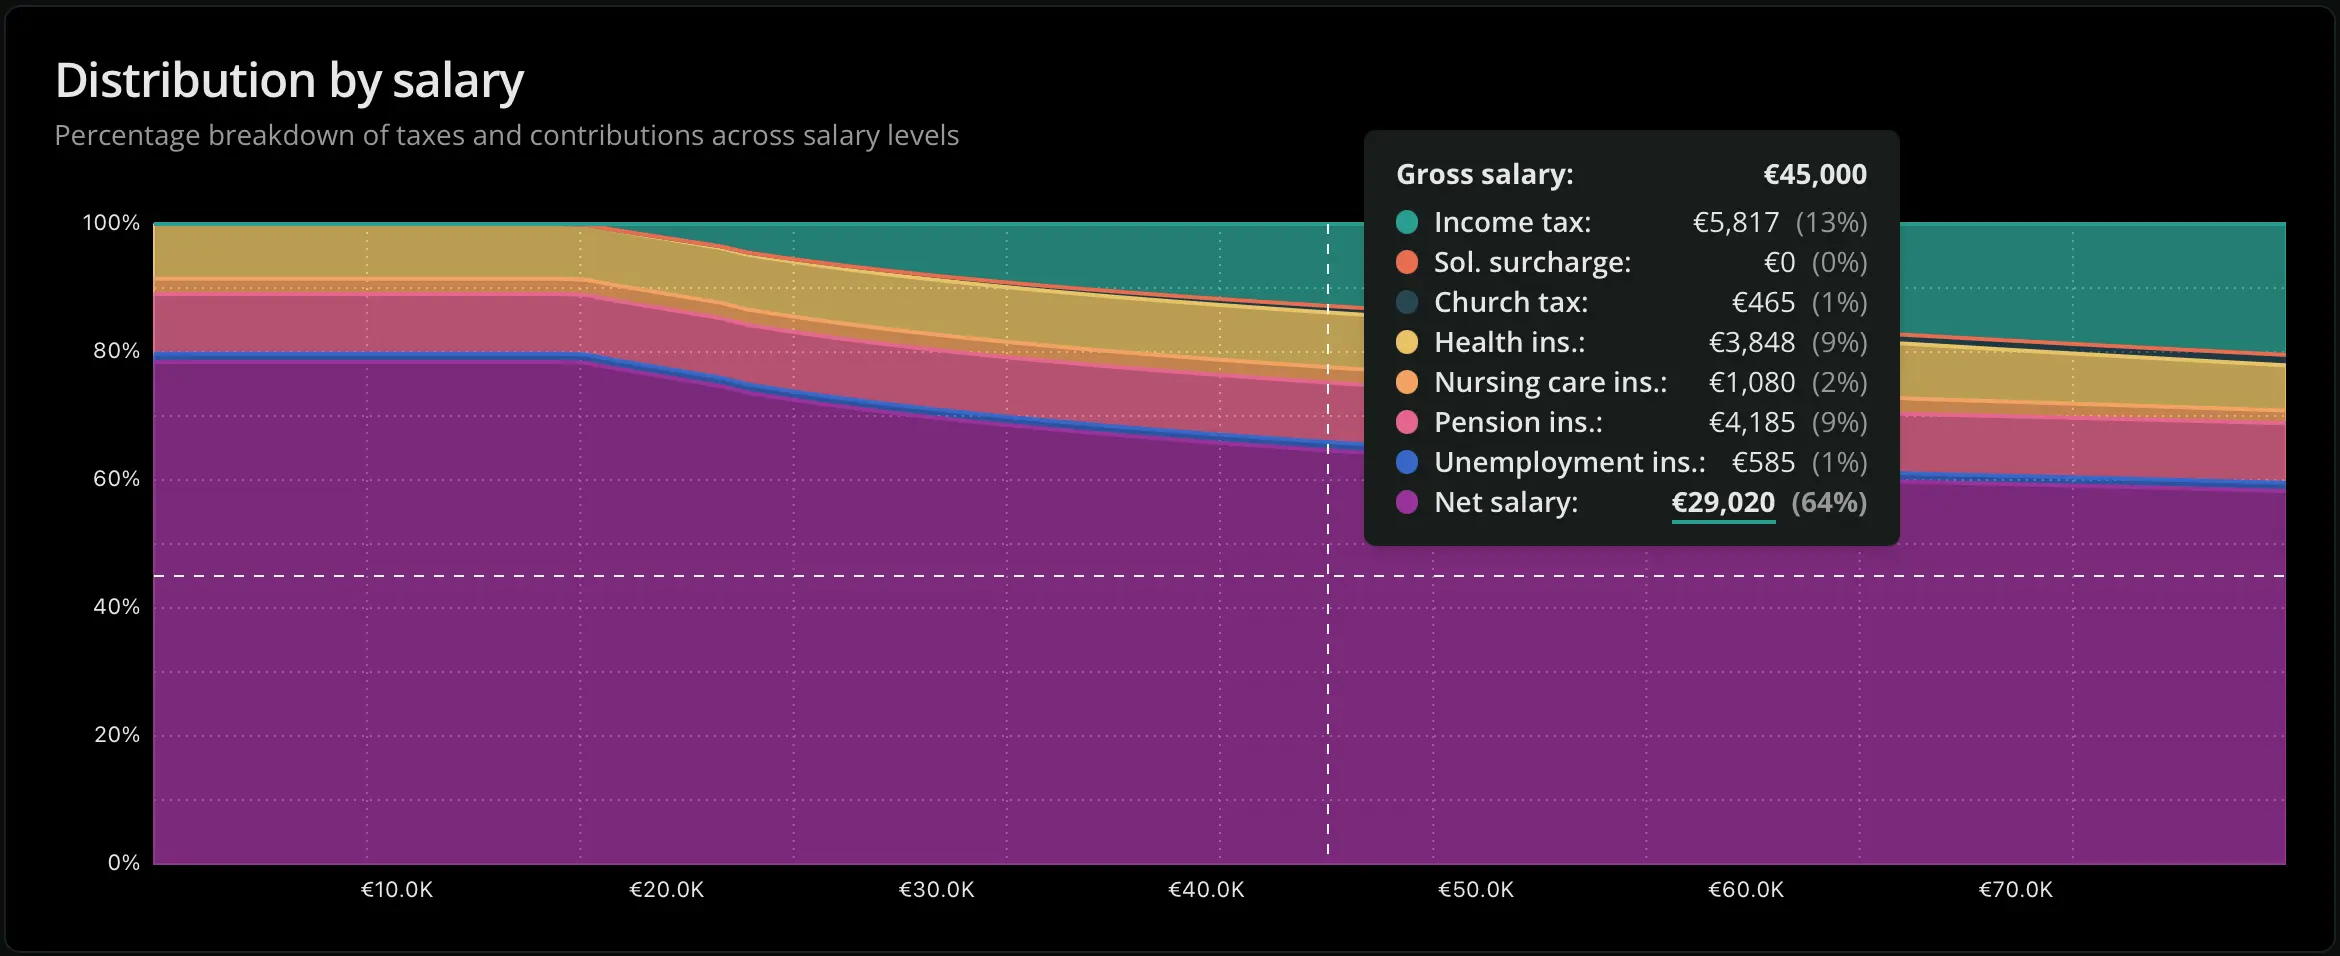
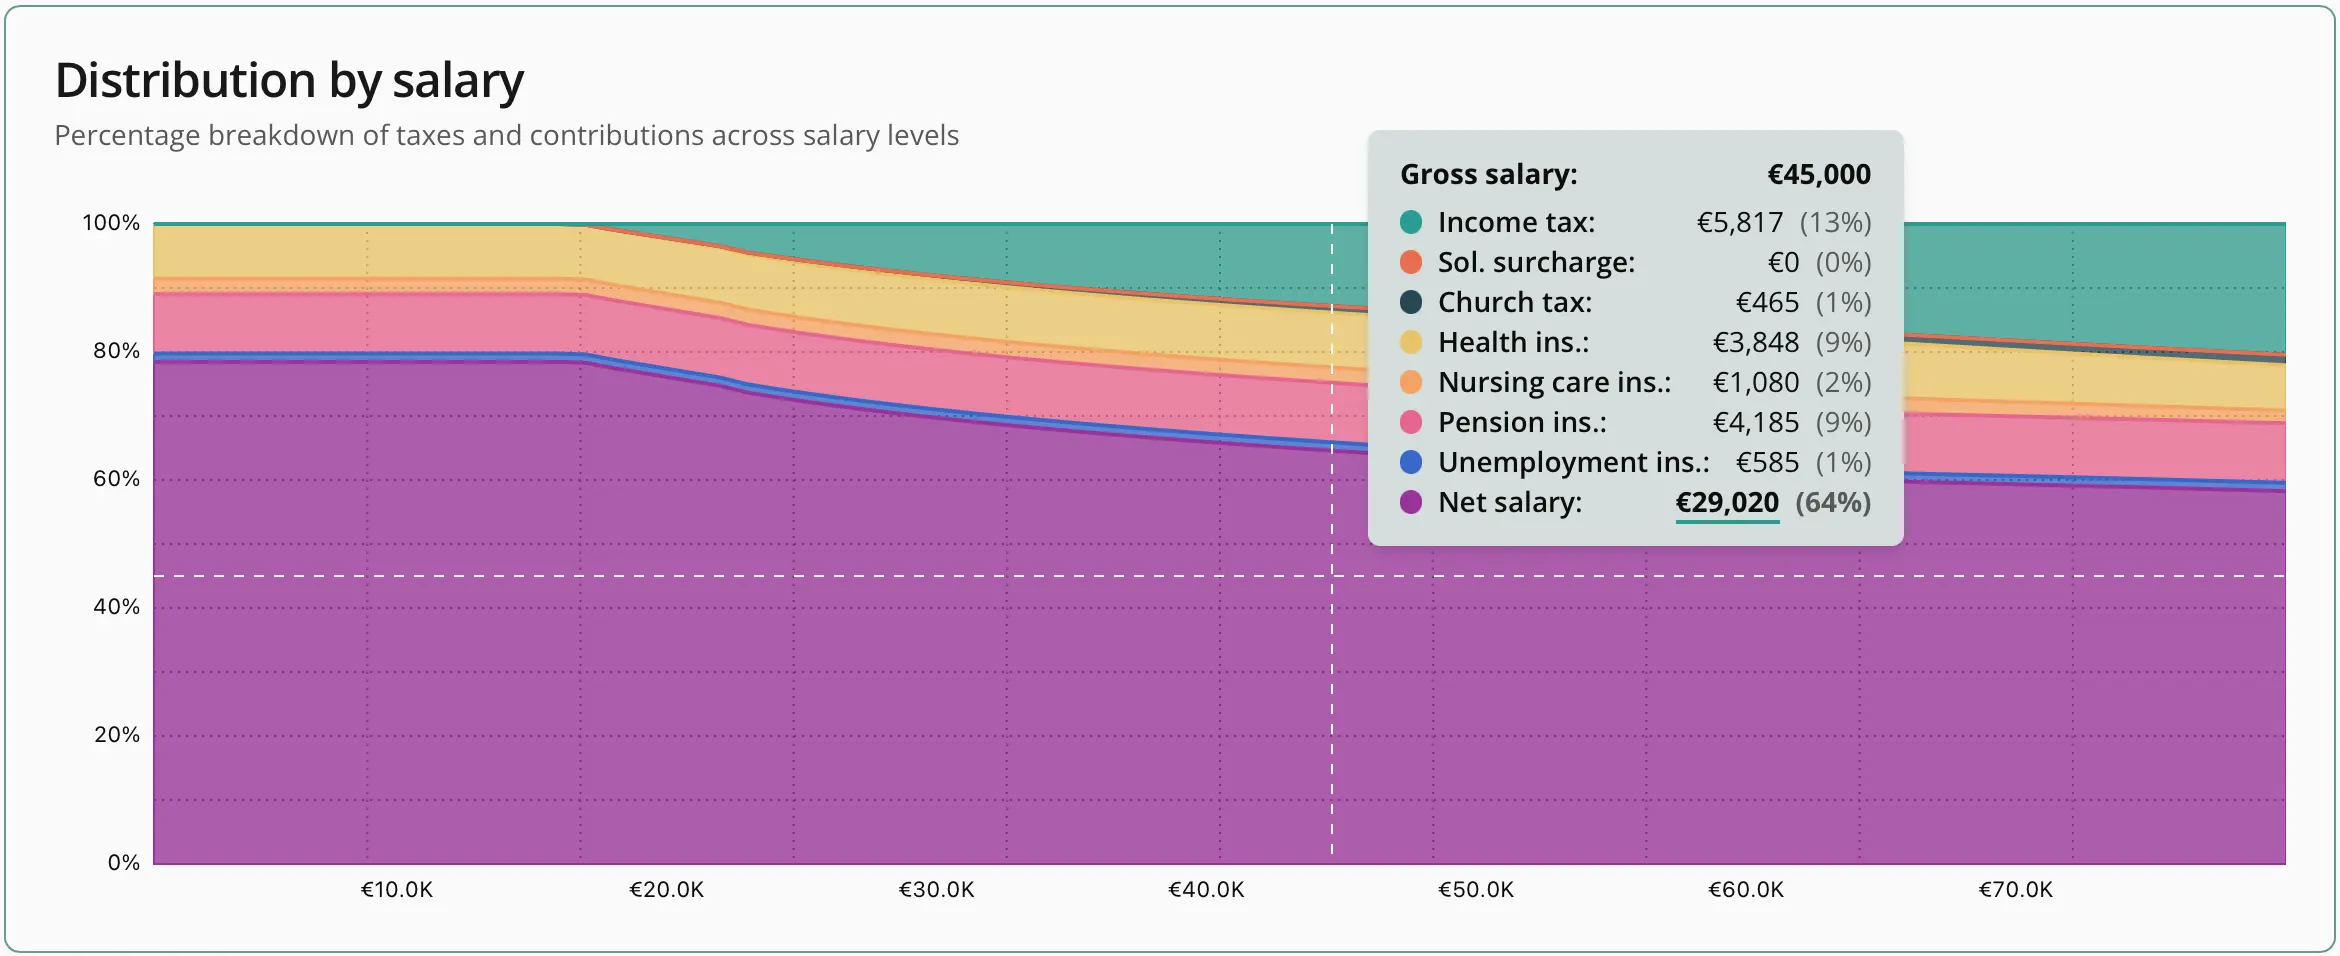
All right, all right. Here’s how the app looks like. Feel free to check out the live version here.
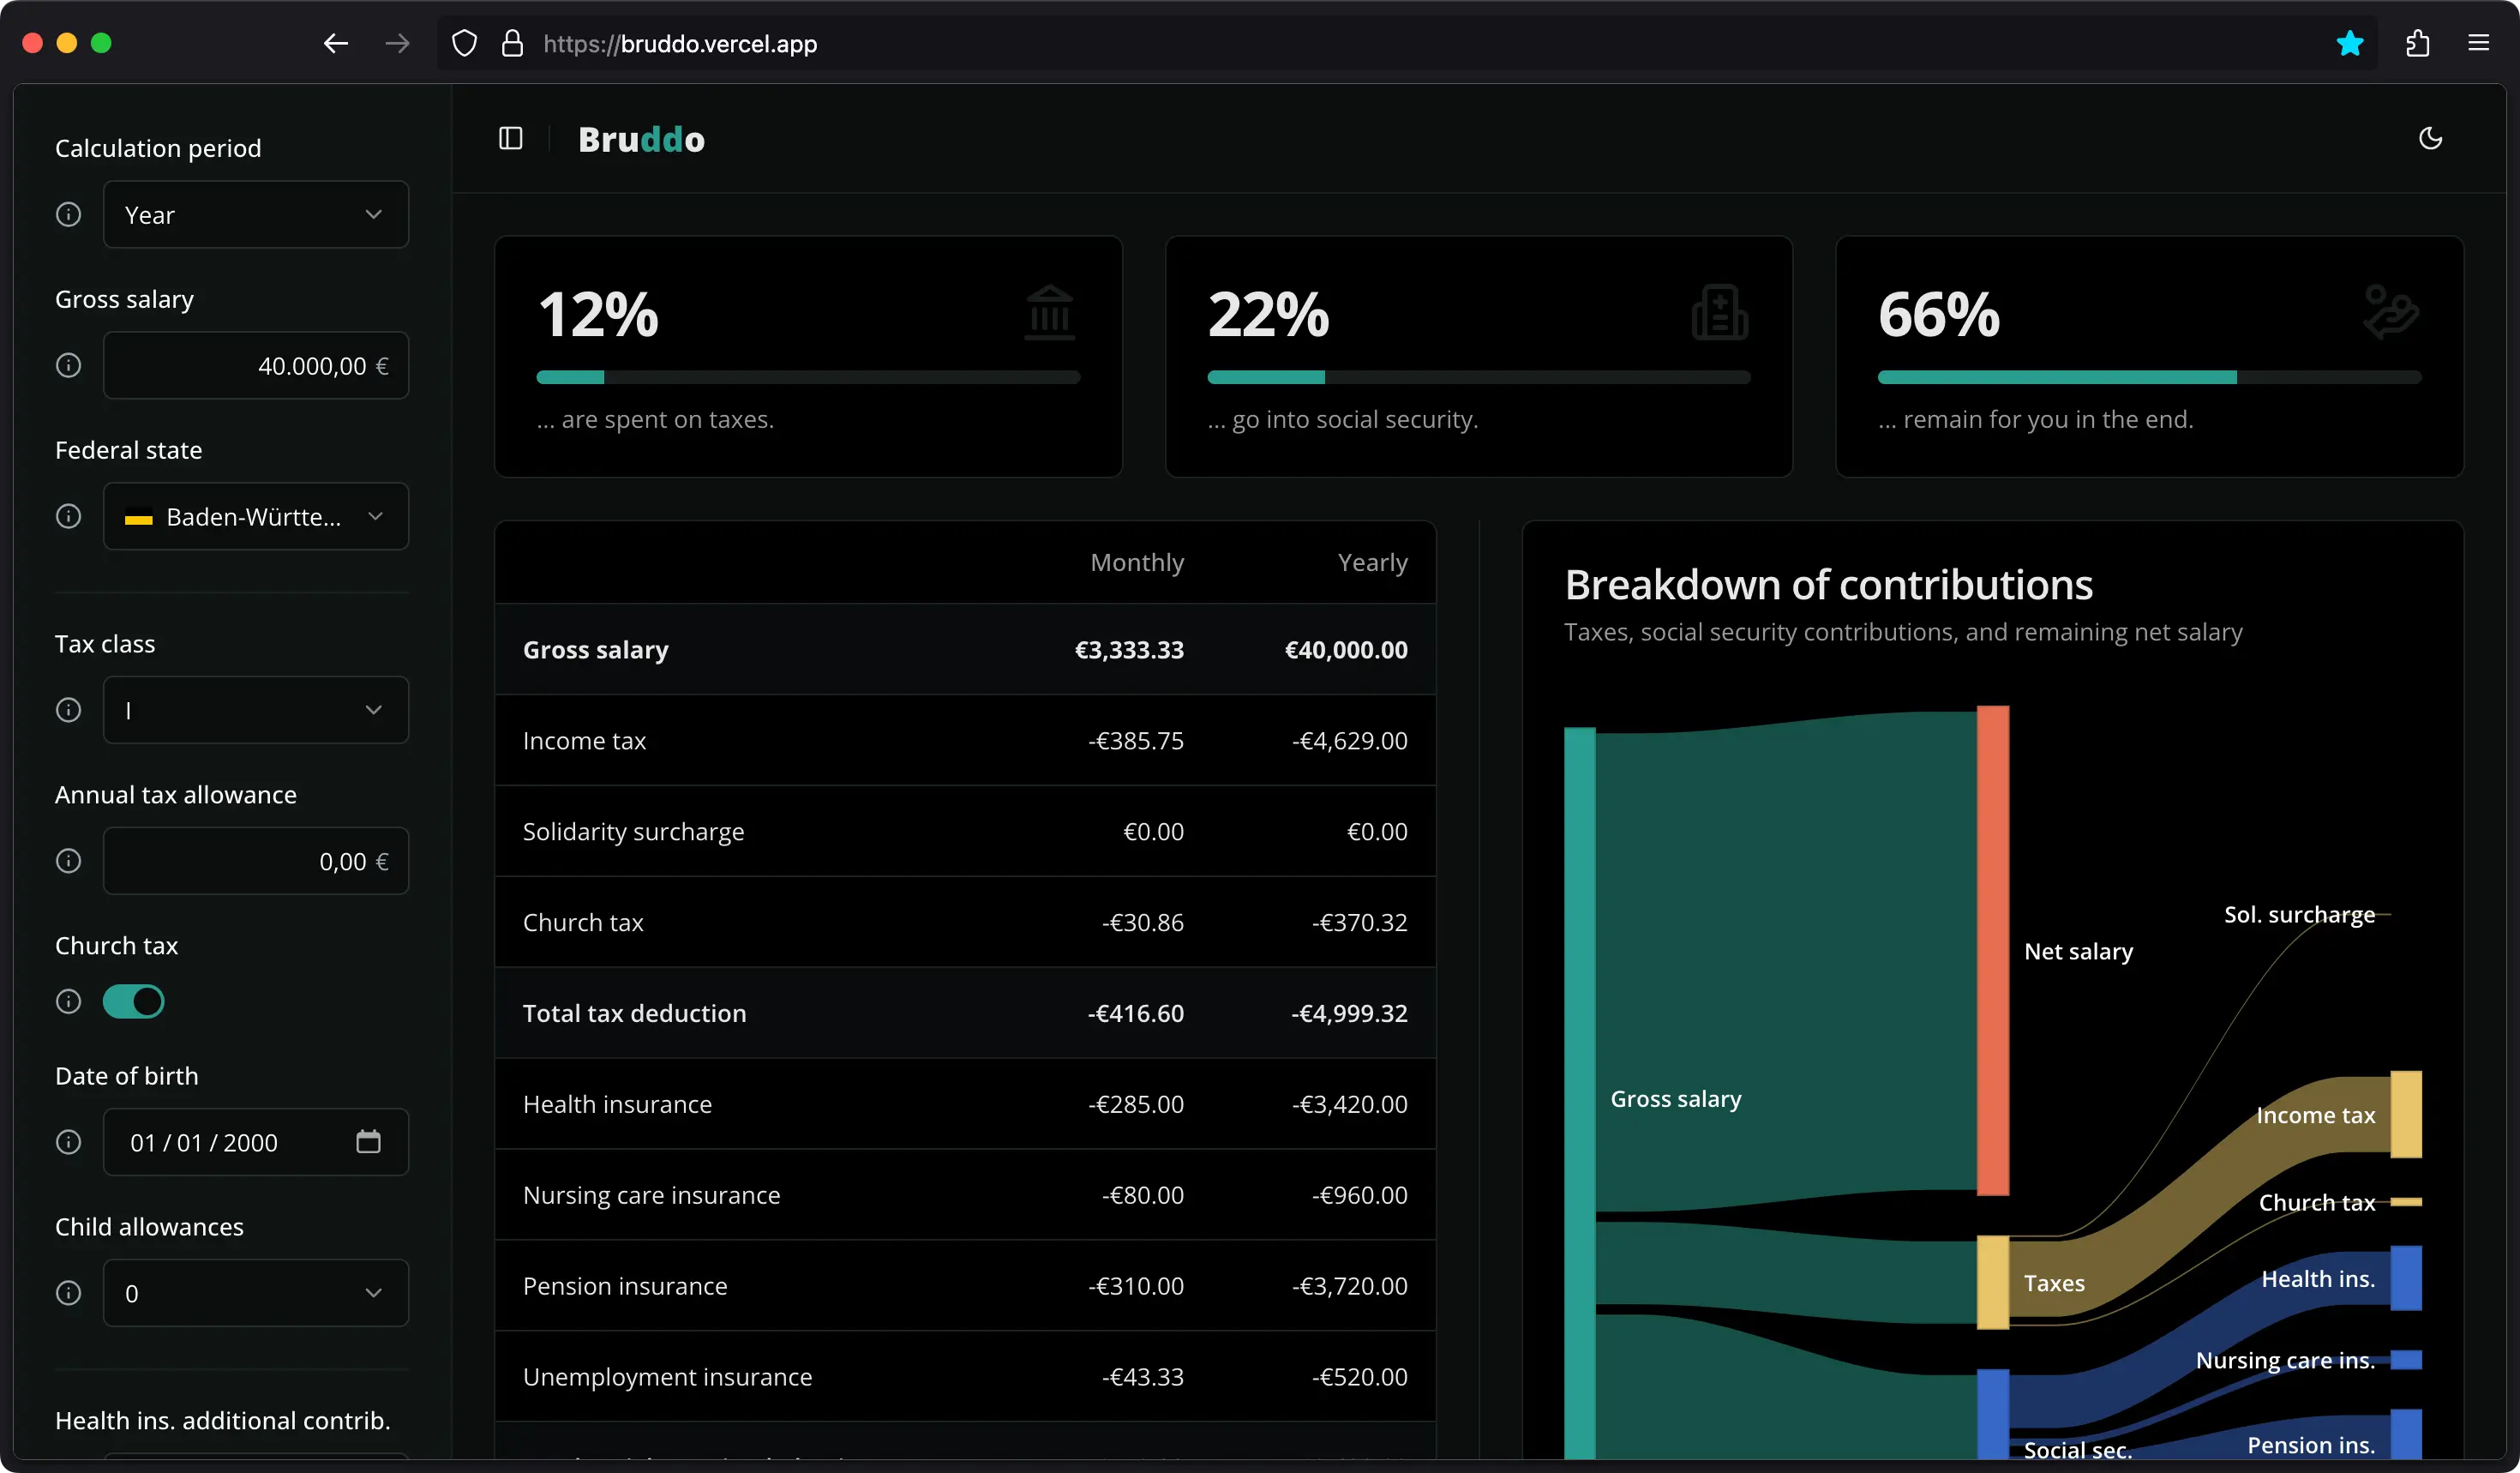
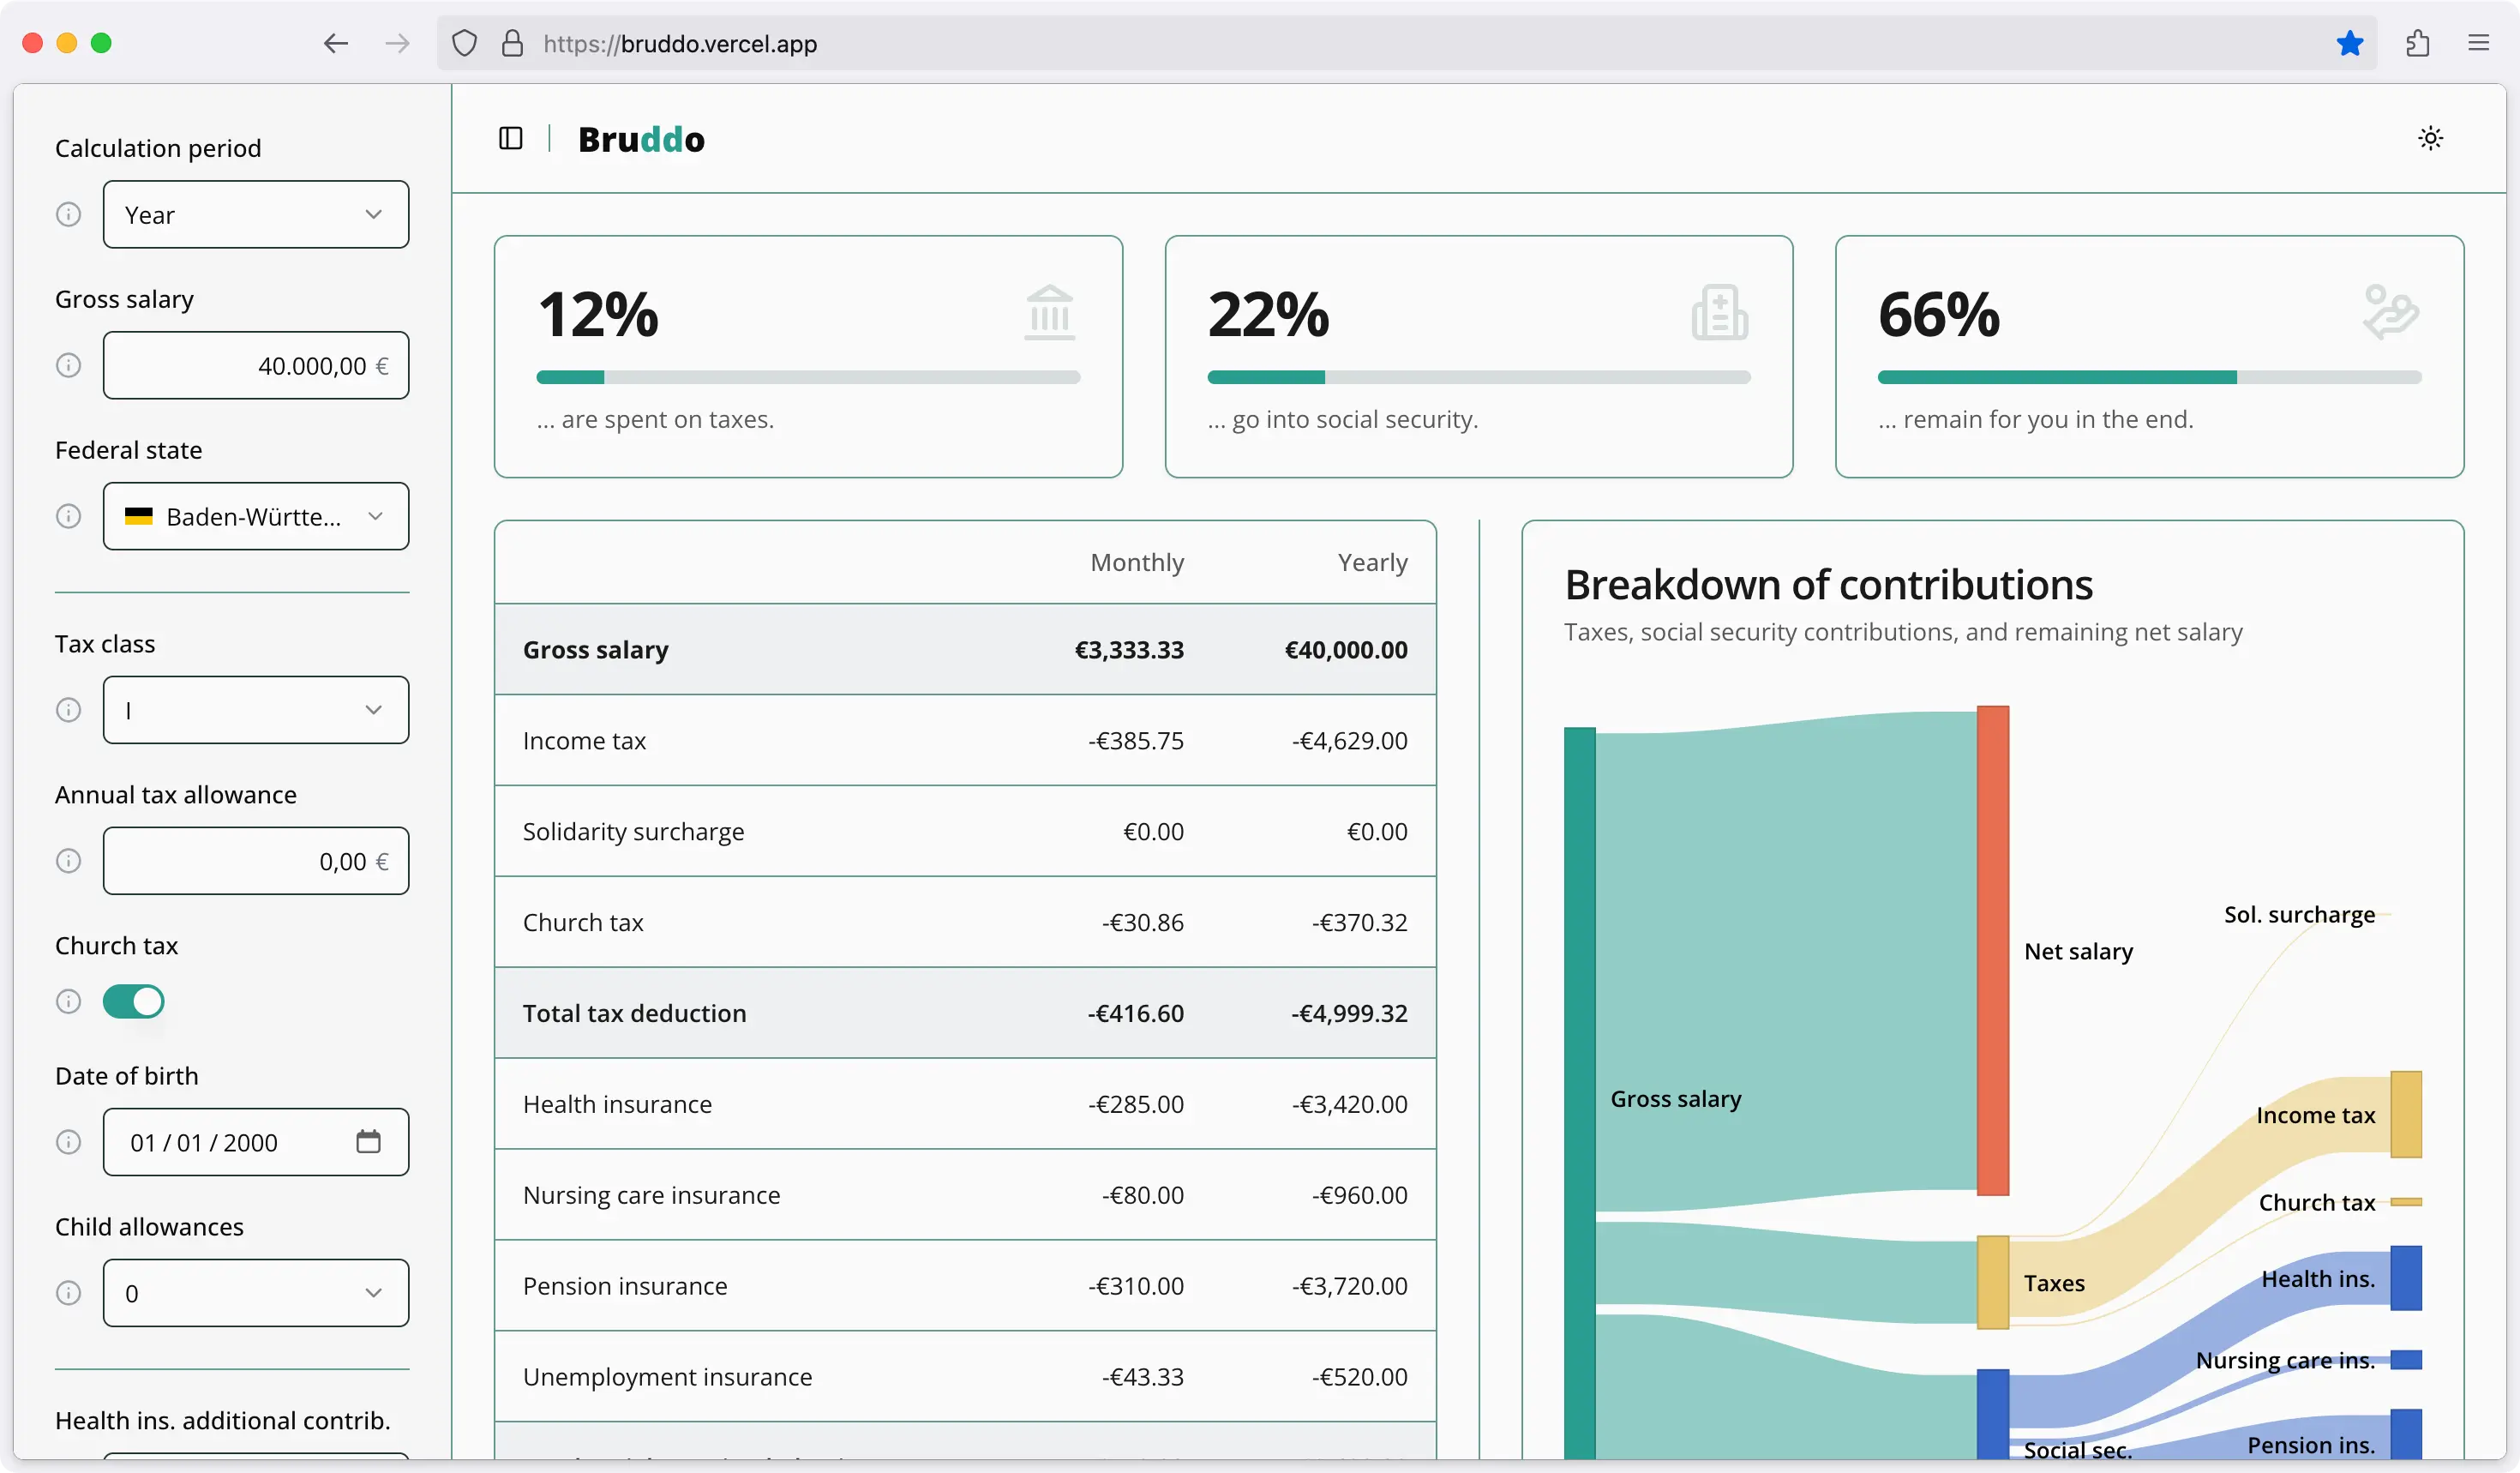
I’d say, the final result closely matches my initial vision and definitely offers a more interactive experience than traditional salary calculators. In terms of visualizations I ended up with a Sankey chart to display the breakdown of the gross salary as well as a stacked area chart that provides a comparison of taxes and contributions across different salary levels.
Conclusion and open tasks
Retrospectively, this wasn’t the most technically challenging project, but that wasn’t the point anyways. I feel a bit more comfortable with my knowledge on taxes and all kinds of other contributions, but honestly, I wouldn’t recommend this approach as a way to learn about this topic. As you might imagine, those 57 pages of flow charts and variable definitions are not the most engaging reading material. In the end I spent maybe 10% of the time actually learning something while implementing. The rest was spent on, well, typical development overhead. But hey, at least now I have a calculator that I’m actually looking forward to use.
Still, there are several things I’d like to improve upon:
- Apart from a few given examples, the BMF document provides basically no plausibility checks for the 33 input parameters and their dependencies. I think I handled the most important bits, but I’m quite sure there are many edge cases I haven’t considered, especially field interdependencies.
- Right now, the app has only been tested manually, comparing the results with other calculators. This works fine, but of course doesn’t scale well and also assumes that the other calculators are indeed working correctly and up-to-date. It would be nice to have some automated tests, especially to test for regressions after changes in tax laws. A good starting point would probably be the BMF-provided table with some example results for the income tax calculation. Although it unfortunately only covers two dimensions (gross salary and tax class).
- While I was implementing everything, an updated program flow chart has been published, which is supposed to be applied from 1 March 2025 onwards. This means that the app is already outdated. Nice.
- The app could definitely benefit from some refactoring, as it, for example, currently only supports one tax year (2025). If you’ve ever used other calculators, you know that they usually support a range of years.
So, if you’re interested in any of these topics or have any suggestions, feel free to open an issue or even better, a PR.
Footnotes
-
Just gonna leave this here: https://www.kirchenaustritt.de ↩